Note: SPK16 is now released as a kit with build description
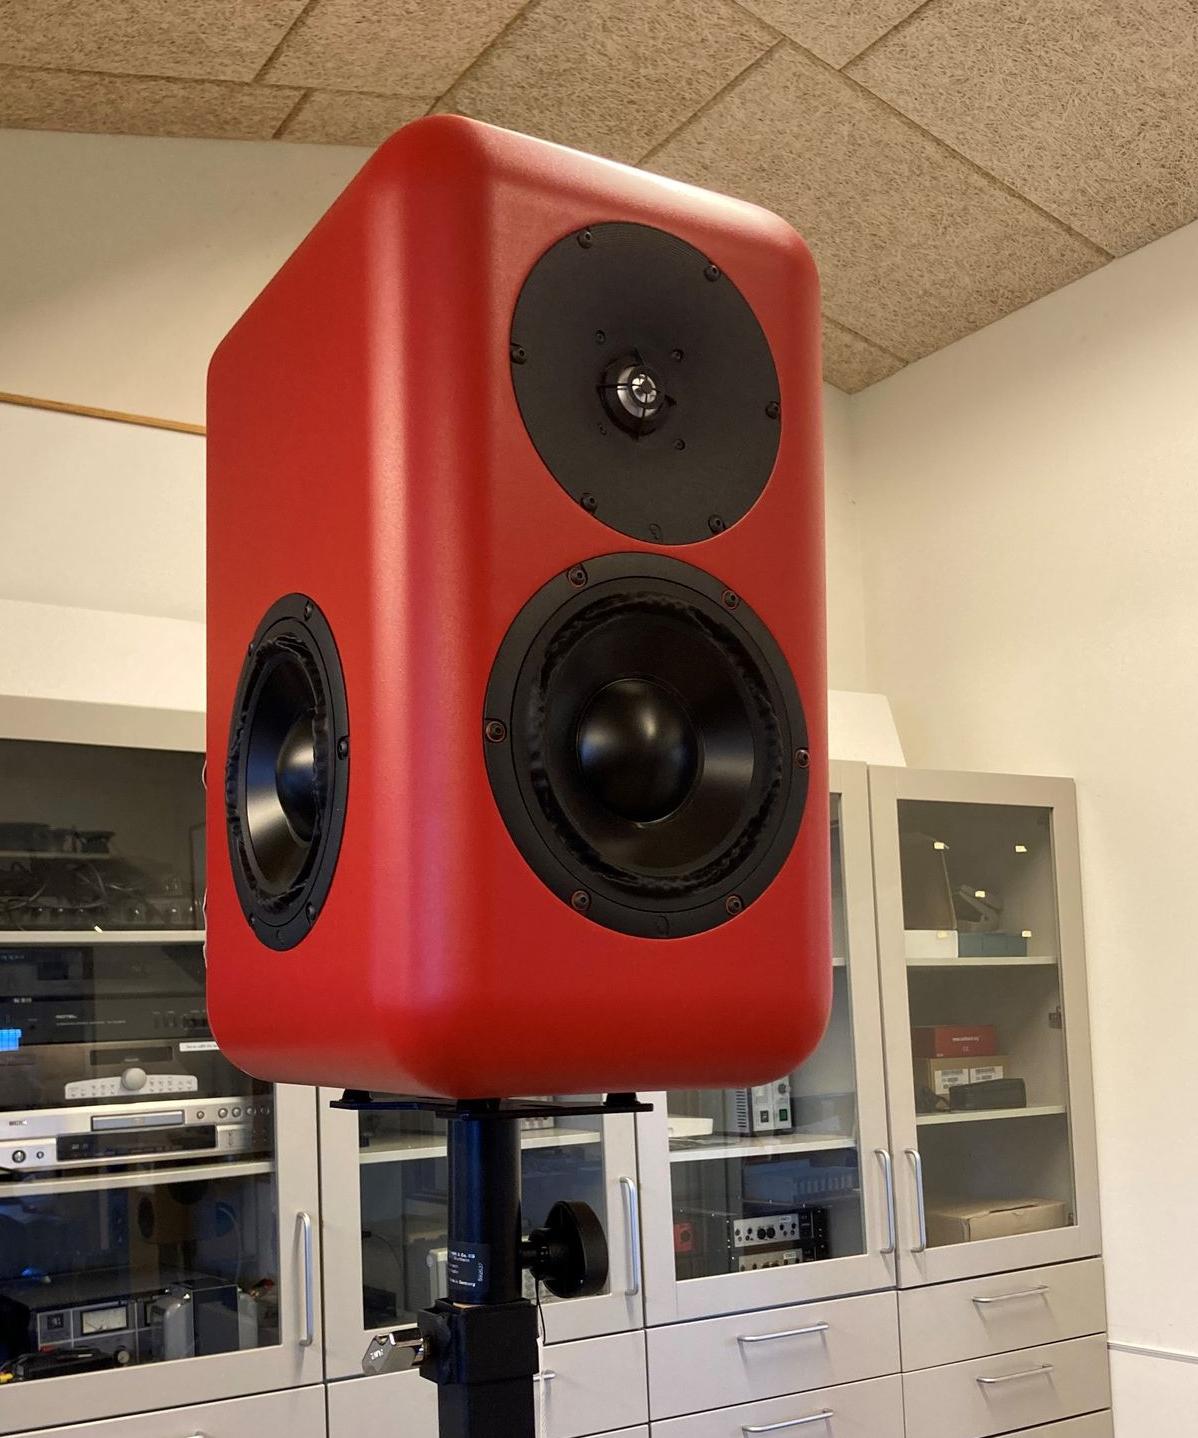
SPK16 is a passive 2 way speaker system with a 6.5X-NAA alu cone woofer assisted by two passive radiators on the sides of the box combined with a prototype of the coming PTT 33mm long stroke dome tweeter. The reference design is the result of multiple and novel computer aided design steps to break through current performance barriers.
Goals and Challenges of Speaker System Design
The goal set out was to obtain a passive system setting new standards for extreme and ultra flat bass extension combined with very wide, constant, controlled and smooth dispersion maintained all the way to 20kHz. In addition, leveraging the ultra-low distortion and IMD of the PTT drivers. Such combination sets new standard for the sonic realism experienced by the listener combined with ease of speaker placement.
Challenges Below 3-400Hz
The recent advent of Klippel NFS system in the hands of independent reviewers gives abundant access to high quality anechoic responses for many speakers on the market. Often the frequency response below say 400Hz has humps and dips or is generally not flat. Such anomalies are critical since this frequency range covers the critical fundamentals of many instruments and human voices These irregularities may be caused by a combination of the difficulties in measuring the free field response accurately at these frequencies and the interaction between the crossover network output impedance and impedance of the driver. The driver has high impedance peaks determined by the bass alignment used. On the sides of these peaks the driver is respectively inductive or capacitive. In combination with the inductors and capacitors of the crossover filter we get dips and peaks which are not accounted for in the typical box simulators.
The typical gated measurement with a 5-10 msec windows cannot be trusted below a few hundred Hz. In this range we have the crucial baffle step, bass roll off and filter-driver interaction. Near field measurements have the challenge on how to combine the outputs of the woofer and port/PRs and they lack the baffle step which must be assumed. Even large full blown anechoic rooms have limitations beginning below say 50Hz. An outdoor boundary measurement on a large empty parking lot is a viable option but not very practical.
The solution chosen is to use a model-based optimisation of the bass alignment and woofer crossover network.
Challenges Above 3-400Hz
At frequencies above 3-500Hz the dispersion (off axis responses) is typically first known after the box has been built and measured. Design choice is the filter cannot change the directivity of the drivers. Only a redesign of the box can change it.
The typical design process may include review of deriver data sheet measurements. These are done in infinite baffle (2pi) and lack the influence of the box as will be measured in free field (4pi). As a result, it is often seen that tweeter waveguides get too big and deep since 2pi dispersion is wider than when the same driver is placed in a box and measured in 4pi.
The solution is to optimise the tweeter wave guide so that it provides constant and smooth directivity in combination with the chosen box and measured in 4pi. As we shall see, this results in a less deep waveguide compared to what is often seen.
High Frequency Dispersion
Typical tweeters of today sadly have rapidly narrowing dispersion above say 8kHz. This shortcoming is typically ignored in reviews or even considered benign in some cases. As this reference design demonstrates, maintaining wide dispersion much higher up in frequency up is critical for the perceived sense of space and natural timbre.
The PTT tweeter dome shape has been carefully computer optimised for wide dispersion. In addition, the SPK16 reference design uses a waveguide with integral acoustic lens elements a.k.a. a ‘Coherer’ that shapes the wavefront at the throat to widen the dispersion.
COMSOL model of the Box Including Drivers
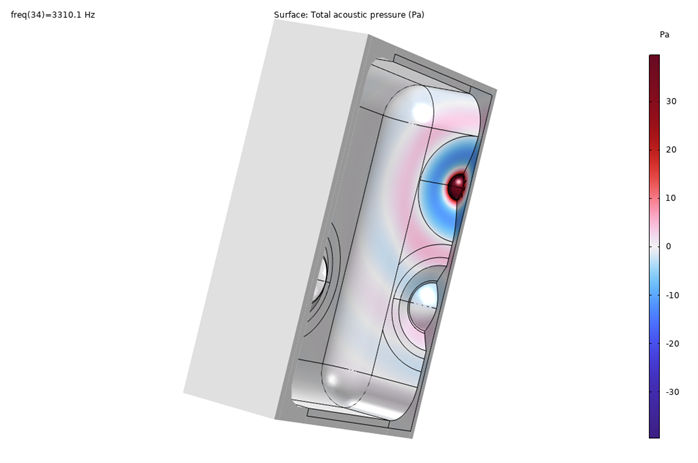
Several 3D FEA models of the box was constructed. The primary 3D model was used to simulate diffraction of the box, e.g., to estimate the baffle step for the woofer which is later used an input for the bass alignment and filter optimisation. Similarly, the radiation pattern of the tweeter in its waveguide is found using the 3D mode. The primary model only models the pressure acoustics just around the box inside a rectangular Perfectly Matched Layer (PML) and the far field response extrapolated using COMSOL's exterior field node. The left-right symmetry of the box is utilised to save CPU time and RAM.
The following figure shows the surface pressure around the box when the tweeter reproduces a 3.3kHz sine wave:
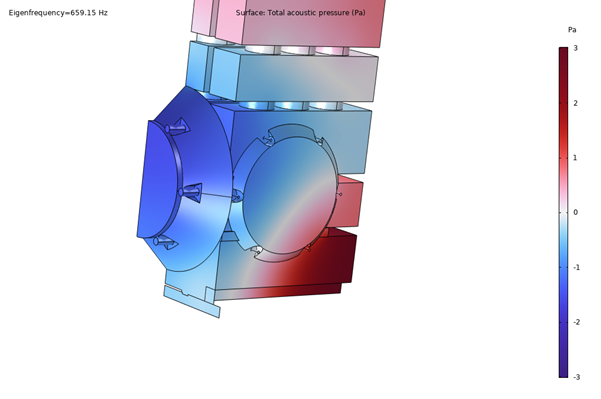
As a CAD model of the interior construction of the box was made, a second 3D COMSOL was used to simulate the acoustic modes of the air inside the box in 3D. It was verified that the extensive plywood bracing matrix was acoustically transparent and not creating cavity resonances. Here is one of the box air modes:
Similarly, a 3rd 3D model of the body of the box was simulated using Solid Mechanics to identify the structural modes. Here one of lowest modes shown:
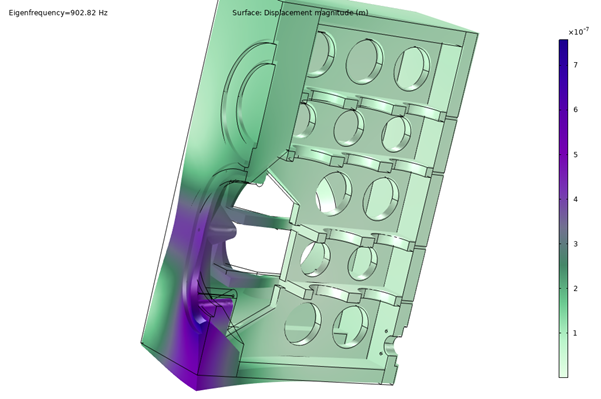
A formal optimisation of the structural design was outside the scope of this design but would naturally be included in the design flow in the future.
Co-optimised Box Tuning and Crossover
Most of the design choices regarding the box shape, bass tuning and crossover filter were determined by a combination of 3D FEA simulations and optimisations even before any box was built. The method presented here relies heavily on models of the low frequency response by combing a box model with the 3D simulated baffle step and the electrical interaction between the woofer and the passive filter.
Box Model Parameter Identification
The woofer and Passive Radiators are mounted in a test box. To measure the very high acoustic pressure inside the box we mount a low-cost dome tweeter with the dome facing inwards. This tweeter easily handles the large sound pressure inside the box. Even at a modest sweep level of the typical 2.83Vrms results in SPL in the 150-160dB range which would overload most measurement microphones. The displacement of the sensing dome is proportional to the pressure which results in the voltage produced by the sensing tweeter is proportional to the velocity of the dome. Hence the recorded signal from the sensing tweeter must be integrated to yield the pressure response. The tweeter works in this way up to its own resonance frequency (around 1kHz). We would only need to measure up to 50-100Hz.
The measured pressure reflects the perfectly summed response of the woofer and passive radiators and can be used as a very precise way to estimate the free field anechoic response of the box at low frequencies.
By recording both current and voltage into the driver we can estimate its impedance. Combined with the box pressure it is possible to identify (i.e., curve fit) the parameters of a box model which includes the Thiele Small parameters of the driver and PR plus box volume and box loss. In addition, an electrical model of the blocked impedance (DC resistance and inductive impedance) of the woofer is also identified.
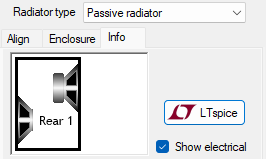
The box model used is the electrical equivalent LT Spice model that Vituix CAD uses. The active and passive drivers are modelled by their T/S parameters and the box is characterized by its volume (expressed by Cab1).
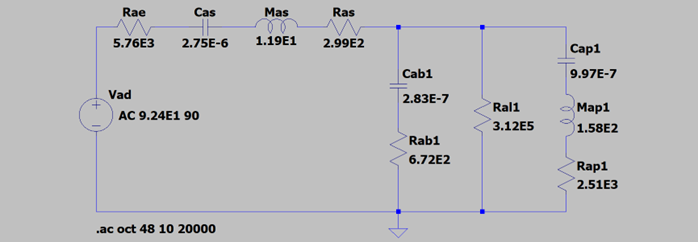
A first model fit was performed in a test box using the intended woofer and a set of PR’s with no additional mass mounted to establish a baseline:
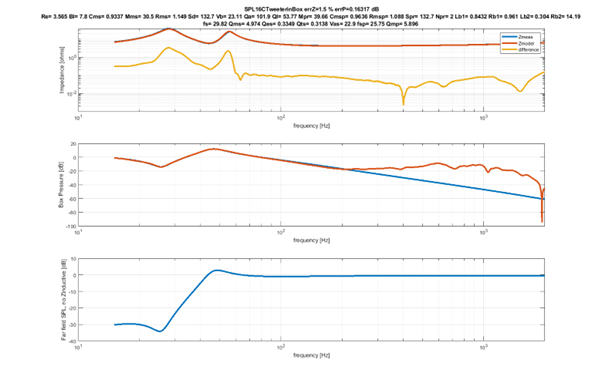
The model fit is excellent and matches the measured impedance with an average error of only 1.5% whilst the SPL inside the box is within a few tenths of a dB. The bottom graph shows the modelled free field response of the PR box. Note that the found bass response is not in any way representing the final result since this is prior to the following optimisation steps. This initial fit is aimed to establish the key parameters of the drivers and box in a tuning not too far from the final. The T/S parameters found may deviate from data sheet values since these are found for the driver in free field and here it is in a box. The test box seems well sealed (Ql is very high) and not too damped (Qa is quite high too).
Model-driven Co-optimisation of the Box Tuning and Passive Woofer Filter
The next step is to optimize the combined response of the box and passive filter. The complex driver impedance with two high resonant peaks is interacting with the passive filter. In addition, the box model is not including the baffle step of the box. The passive woofer filter shall provide baffle step compensation and the low pass roll off at the selected crossover frequency.
A MATLAB GUI was written for the optimisation. A netlist of the crossover is input and compiled into equations. Next we import a baffle step simulated in COMSOL using a 3D model of the box and woofer. The Matlab model combines the PR box model with the blocked impedance model and the xover network to give the response form the amplifier voltage input to the SPL output of the box. The SPL is corrected for the baffle step.
The automated optimisation process adjusts several parameters until the woofer response matches a specified target response. For this project we selected a target response being a 5th order Butterworth high-pass (a PR box system is 5th order) and a 4th order Linkwitz-Riley low pass at the expected crossover frequency of 2kHz (selected from simulations of the woofer directivity in the chosen box size and possible dispersion from the tweeter in its optimised waveguide).
The optimisation tool allows us to lock certain parameters and tune others. The typical approach is that the driver and PR parameters are locked to identified values except that we have the freedom to add additional mass on the PR. The box volume is initially also a free variable so that the trade-off between volume, sensitivity and bass extension can be explored. The filter component values are typically free since they are easier to change later in the process. However, at some point the values of the expensive and bulky inductors are locked to e.g., E12 values. The box volume can be locked at some point on the process.
The woofer filter structure schematic is:
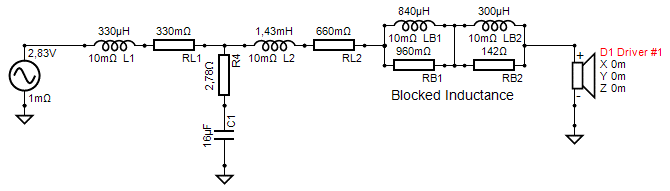
Note that LB1 LB2 RB1 and RB2 forms the blocked impedance network model previously identified for the woofer.RL1 and RL2 represent the DC resistance of the two inductors. Vituix CAD does not model the inductive part in its enclosure tool, so we instantiate that explicitly here and is of course not part of the physical filter. The enclosure model is taken from Vituix CAD so results can be verified in this tool by coupling the schematic and enclosure tools.
An example of the setup of the optimisation process via a GUI:
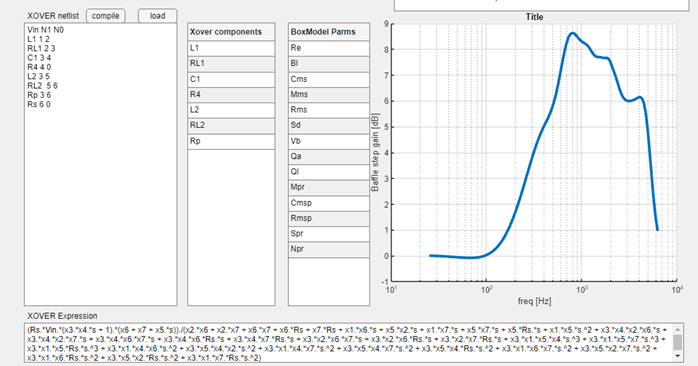
The crossover network is entered as a spice style netlist to the left and is compiled into equations (lower window). To the right is the woofer baffle step imported from a COMSOL 3D simulation which includes the woofer cone shape profile.
The combined system of the crossover, driver impedance and box model is a 10th order system even before we add the baffle step. It is in theory possible to hand optimise the response e.g. in Vituix CAD since the box model is compatible. However, the best result is obtained by doing a computer-based optimistion.
An example of one of the last steps in the optimisation flow is shown below:
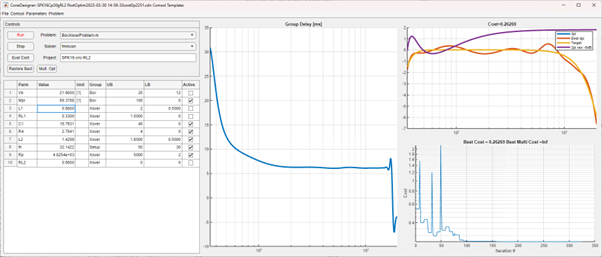
Here we have locked the box volume Vb to the identified value from the model fit using the final box. The moving mass of the passive radiator shall be increased to nearly 70g. The inductor L1 is fixed to a std. E12 value.
The optimisation hits the target response withing an average error of 0.25dB. Note that the bass roll off corner fh is a free parameter, i.e., the optimisation can adjust the target curve to make the fit best possible. As mentioned earlier the chosen target response is a 5th order Butterworth high-pass (ie. Maximaly flat magnitude response).
For the SPK16 reference design we deliberately wanted to show a very extended flat and deep bass response. Hence the optimum requires a rather large volume of around 22L but also a total series resistance of around 1 ohms reach the optimum response. The series resistance in the crossover filter is quite critical since it effectively adjusts the Qts of the woofer. Deeper responses require higher Qts and more box volume.
The result is an ultra-flat bass response with a corner of just above 32Hz which is rather unprecedented for a stand mount 2 way. A further advantage of a very flat bass response is that the group delay stays low all the way until close to the lower corner. The group delay is in the order of only 5 msec at 50Hz (note the graph above includes time of flight from the 3D simulation with the mic at 2m distance).
The purple trace in the top right plot of the optimisation panel shows the raw modelled response of the box without crossover, blocked inductance or baffle step. This raw response as we would see it from the standard box modelling software has to be significantly non-flat into to be flat in the system where the response is affected by the baffle step and interaction with the filter. Obtaining the same flat and extended system response by the traditional experimental trial and error combined with hand optimisation would be very difficult. Especially since acoustical free field measurements in the bass region are very difficult to perform correctly.
The system bass response including crossover filter can be verified using the box pressure measurement:
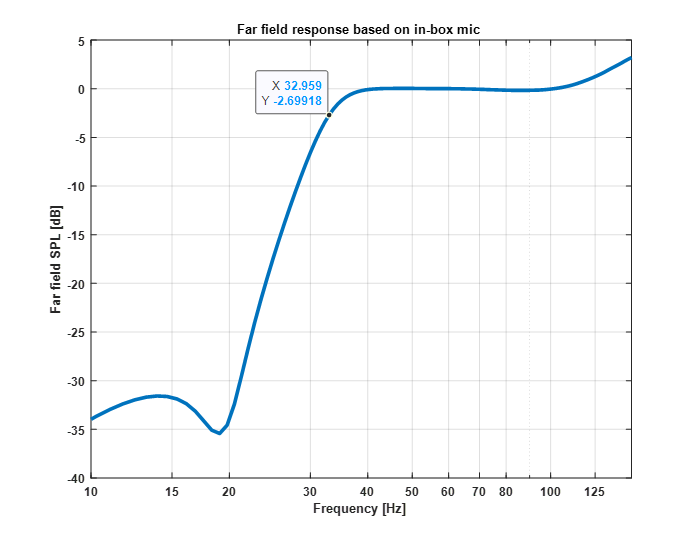
This is an ungated (>500msec) and unsmoothed measurement using the in-box tweeter used as pressure sensor (yes, we know it looks more like a simulation). However above 100Hz, the in-box pressure is amplified by the room gain due to the standing modes inside the box and does no longer reflect the far field anechoic response.
This method is extremely insensitive to acoustics outside of the box. Noise and reflections are highly attenuated when having to pass into the box. Moreover, the sound pressure inside the box is huge leading to a very high signal to noise ratio.
The final crossover design was done in Vituix CAD based on gated measurements. However, no changes were made to the filter response or impedance below 500Hz in order not to mess with the optimised response based on the models. The final filter essentially only has some additional notches to kill the speaks of the woofer cone breakup at 5.5kHz and 10kHz using the techniques described in our App note ‘Low Distortion Filter for PTT6.5X04-NAA’.
Tweeter Waveguide and ‘Coherer’ Optimization for the Box
Simulation Challenges
Tweeter and waveguides are typically optimised for on axis and polar responses in infinite baffle (2pi). However, the responses when measure in a box in free field (4pi) will be much different due to the finite sized box. For this reference design we have chosen to optimise the tweeter waveguide to match not only the specific tweeter but also the specific box to be used. In this way we can control the final system response very accurately.
The challenge is that the free field system simulation by nature requires full 3D simulations which is very slow and requires large amounts of computer memory. In addition, to model the wavefront correctly at very high frequencies, the mechanical behavior of the tweeter must be included into a full Multiphysics model where solid mechanics and pressure acoustics is fully coupled. Assumption of pistonic behavior gets simply too inaccurate towards the last octave below the dome breakup frequency.
Simulation Approach
The approach we chose is to have a fully mechanical-acoustical coupled model in 2D for the dome tweeter combined with a 3D model of the box but only using pressure acoustics. The tweeter surface displacement field is mapped from the 2D onto the corresponding moving surface in the 3D mode. This speeds up the 3D model without giving up the advantage of the fully coupled mechanical-acoustical modelling.
Optimisation Approach
The 3D simulation of the tweeter is used to generate a target response for the optimisation that we for reasons of speed run in the faster 2D model. The tweeter and waveguide in 2D should have a response that predistorts the deviations from the desired response in full 3D.
By running a few iterations of 2D optimisation combined with update of the target response from the 3D model the process converges nicely on a solution that hits the target response closely in the full 3D model.
Optimisation Target Response
The optimiser was asked to produce a constant Directivity Index (ratio between the on axis and power response) from 1.5kHz (below the expected crossover frequency) to at least 18kHz. Moreover, the response must have a single well defined main beam normalised responses being smooth at all horizontal angles up to 60 degrees. This secures that the timbre from reflected sound is matching the timbre of the direct on axis sound. It also secures a neutral timbre even in very lively reverberant rooms. Its generally believed that such radiation pattern gives the best possible sound stage.
HF Dispersion Control
The radically new approach used is to require that the beam width is kept up all the way to or past 18kHz. Often tweeters show narrowing beams even before 10kHz.
To achieve this unprecedented wide dispersion beyond 10kHz we use several synergistic techniques. For starters we use a hard dome that remains pistonic to ultrasonic frequencies. This in it self is a good start for keep wide dispersion since soft domes end up being ring emitters at high frequencies where the central part of the dome is decoupled mechanically. Ring emitters have worse dispersion than a flat disk. But a dome is not just a dome so the shape of the 33mm tweeter prototype that has been optimised for the best possible dispersion balanced with a reasonably high break up frequency.
The second being using a ‘Coherer’ i.e., a collection of ring-shaped objects that shape the wavefront around the throat of the wave guide in order to direct energy to the further of axis directions. Finally, the wave guide shape is of course critical for both controlling (ie narrowing) dispersion at the low end of the frequency range and yet allow wide dispersion towards the high frequency range.
The optimisation process is co-optimising the waveguide shape and coherer together which involves quite a few degrees of freedom.
The resulting horizontal normalised radiation pattern from the full 3D simulation speaks for itself:
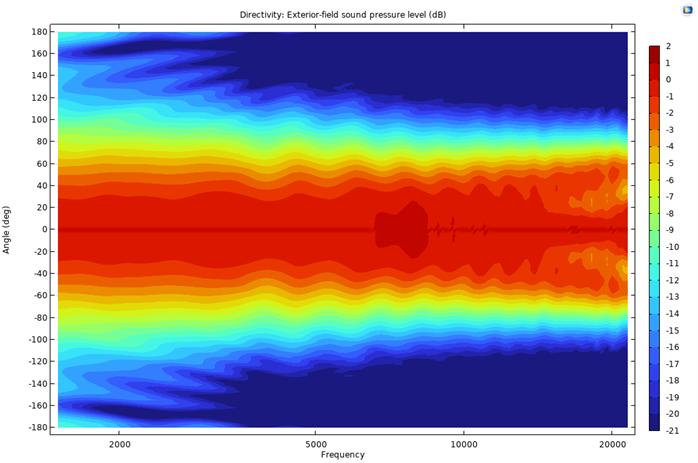
Interestingly, the optimisation resulted in a waveguide being relatively shallow with a depth of only 16mm (which is surprisingly shallow compared to its 147mm diameter). This would indicate that many waveguides seen in the wild for similar box sizes may in fact be too deep (perhaps go into the horn category).
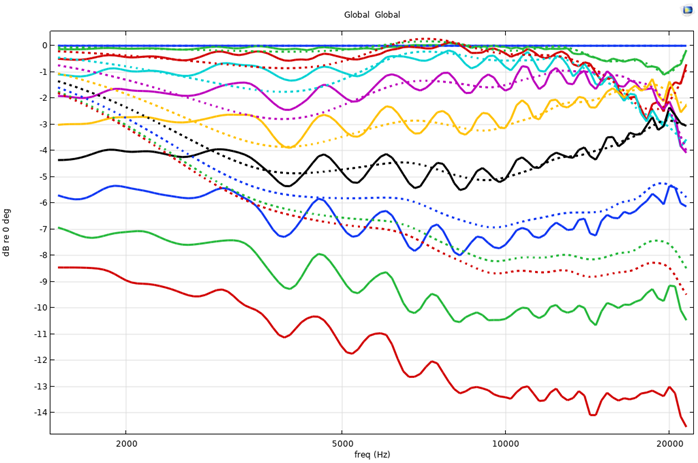
The following plot shows the free field (4pi) 3D simulation (solid) of the tweeter in the box compared to the 2D simulation in infinite baffle (dotted). The curves are for multiples of 10 degrees up to 90 degrees. All responses are normalised to on axis (0 degrees). As frequency goes up, we see that the 3D and 2D curves converge for all curves up to 70-80 degrees. However, at 1.5k-5k we a substantial difference between 3D and 2D where 2D (2pi) is close to omni at 1.5kHz whilst 3D shows a beamwidth of around +-70degrees. At around 3khz we have the opposite where the 2pi response is narrower than for the in-box 3D simulation. This highlights the stated importance of optimising the waveguide to give constant directivity in the box and not in 2pi.
The in-box measured free field performance comes very close to the 3D simulation here in 10 degree steps up to 120 degrees (measurement at 1m using gating):
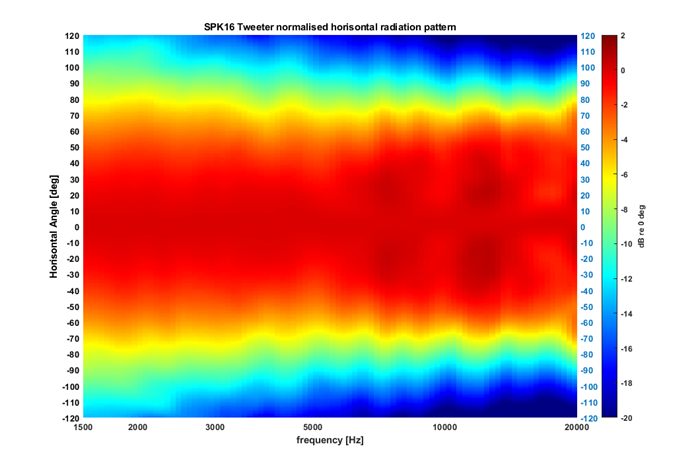
We see that all normalised responses up to 70 degrees are flat and smooth and even smooth beyond 70 degrees. The beam width (-6dB points relative to on axis) up to 20kHz is a staggering +-70degrees.
Conclusion
The presented methodology allowed a very fast box design process with a minimum of experimentation thanks to the use of accurate multi domain modelling and optimisation. The goals of very flat extended bass response combined with constant wide and controlled beam width up to 20kHz was achieved.