Read any Purifi interview and someone is sure to mention hysteresis distortion (or iron distortion, same thing). What is it about and how serious is it?
Hysteresis happens in any coil that has a magnetic core. For instance the iron yoke in a speaker driver. It sits inside the voice coil. Or cored inductors in crossover filters. Or the ferrite inductor in a class D amplifier. The cause is the ferromagnetic material that’s added to inductors to bring inductance up to usable levels. Come and explore this one with me. It’s fun, and ever so scary.
I’ve rigged up a B/H (flux density / field strength) test setup. It’s the same method used by manufacturers of ferrite materials.
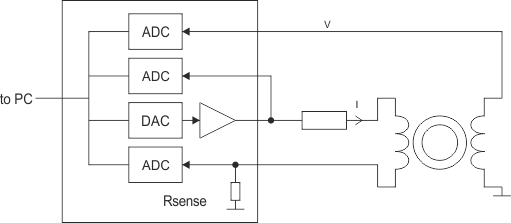 Figure 1: Test circuit
You take a toroid core and put windings on it. The field strength H is caused by the current you feed into the windings. The core responds to the field by creating a magnetic flux. Finally, the rate of change of that flux induces a voltage in the winding. I can’t measure flux directly but I can work it out by integrating the voltage. To avoid also measuring the voltage drop across the DC resistance of the wire I put two windings on, one to pump the H field (by feeding current through it), and the other to measure the voltage in the absence of current. I.e. it’s a transformer.
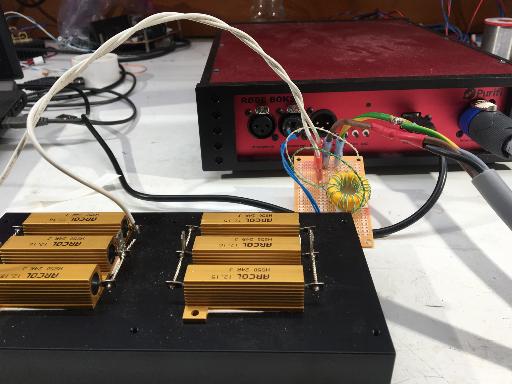
Figure 2: DUT and kit.
All the graphs you’ll be seeing are measured on this physical item. They’re not simulations. I’m not even aware of a circuit simulator capable of modelling what you’re about to see.
First we trace the B/H curve like it would appear in a data sheet. This is hysteresis as we know it: the curve follows different paths up and down because hysteresis is sticky. We get a loop.

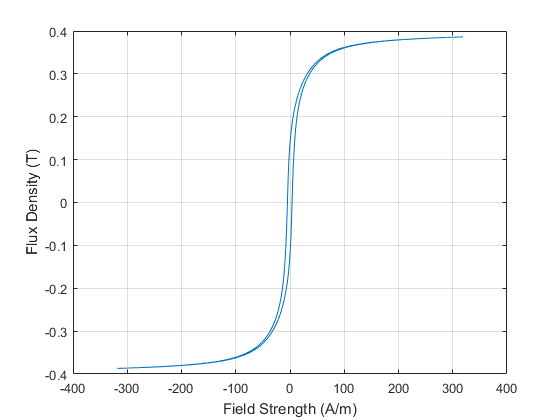 Figure 3: BH loop up to full saturation
This animation shows how the measurement proceeds.
The bottom graph shows the data that’s been captured. The blue curve is current, and it corresponds with the horizontal axis (H) in the top graph. The red curve is voltage. As voltage is the derivative of flux, all we need to do to know B is integrate the voltage. The magnetic field used in this test gets quite strong. Most of the time the core is fully saturated and during that time B doesn’t change. So the voltage spends most of the time close to zero. It only spikes up when the core is out of saturation. That spike is the only time in the graph that the core is really doing its job.
We don’t willingly drive a coil into saturation in normal use, so I propose to do all further tests at a much lower amplitude. A lower amplitude produces a smaller loop. Here are a few with various amplitudes.

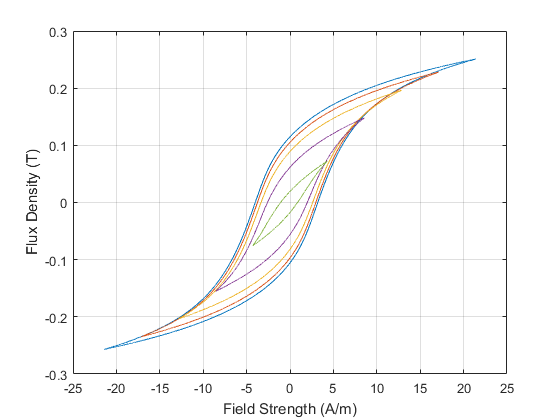 Figure 4: Family of smaller hysteresis loops
Note that the loop never closes. Unlike most forms of distortion, hysteresis distortion does not disappear at small signal levels. Percentage wise, it remains fairly constant over a wide range of signal levels. In a plot of distortion versus level, a long and nearly horizontal stretch can be an indication of a hysteretic mechanism at work.
Now remember that the B/H curve is essentially a test of permeability. Permeability is the slope of the curve. When we did the “data sheet” test we drove the core into complete saturation so the curve runs horizontally. With a smaller curve that’s not the case and now we see something rather curious: the slope is not the same going up or coming down. In fact, the curve is much steeper as you’re going towards one of the ends of the curve than when you’re going away from it again.
Look at the amplitude/voltage measurement:
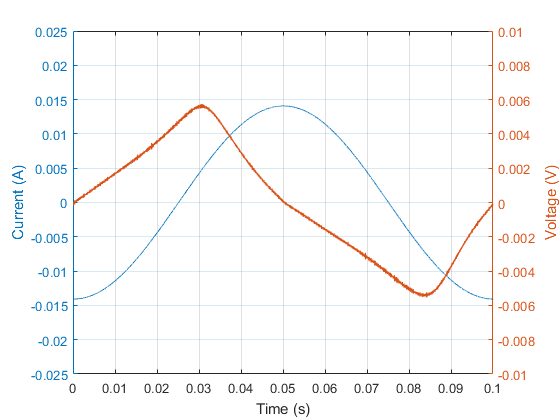 Figure 5: Current and voltage waveform associated with one of the smaller loops
When the rate-of-change of the current reverses direction, the slope of the voltage clearly kinks. The permeability of a ferromagnetic material is not very well defined, to put it mildly. This points at a massive complication: what happens when you’re tracing a large BH loop and you decide, halfway up the slope, to retrace your steps for a bit before continuing up?
Here’s a loop measured with a sine wave with a third harmonic added in:
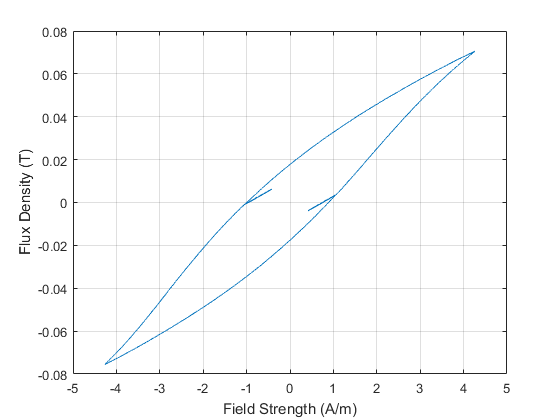 Figure 6: Loop with traced with direction reversal
I think we need to look at the animation to follow what happened here.
As we turn back, the BH curve will not simply retrace. Instead, it goes off on a shallower slope that slowly steepens. And, once we go forward again, it will once again start on a shallow slope that slowly steepens. In effect we end up tracing a minor loop that closes again at the place where we first turned round. Having made this little detour we will now continue upward. And here happens the hair raising bit: the loop suddenly switches tack instantaneously to continue exactly along the original, major loop as though nothing had happened.
While H (or I) continues smoothly the only thing that changes suddenly is the slope of B. Voltage being the derivative of B, you get a crisp step when the ferrite core comes out of the small loop and re-enters the big one. Let’s zoom in on one of the minor loops:
The step happens at the point where the current passes the value it got to previously, before it started going down again. A voltage step sounds like a pop. It does not happen because of something that the input signal does at that particular time. It happens because of something that the input signal did a while ago.
I need to drive this home. For reference, here are the waveforms again. I’ve marked one of the two steps.
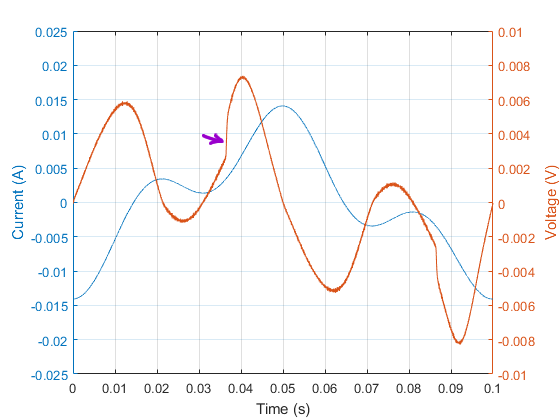
Figure 7: Voltage and current waveform with direction reversals
And here’s the waveforms for the same test except that I’ve inserted a pause in the test signal halfway through the minor loop. The step still happens at the exact same point:
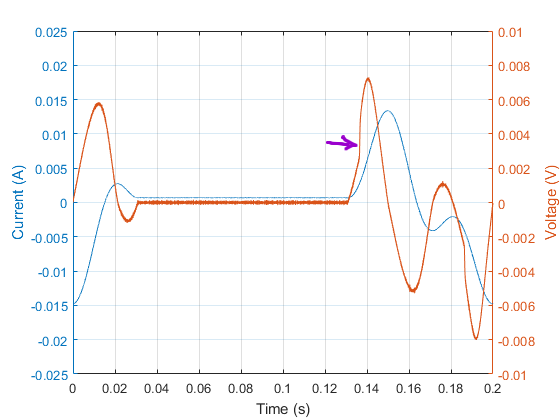
Figure 8:Voltage and current waveform of same test but with a pause (note different x scale)
Simply put: letting time go by changes nothing. The core has a memory that persists until it gets erased. Every time the current stops rising and starts falling or vice versa, a trace is left in the core. Every time the current passes a point where it turned direction, that trace is erased and a voltage step is produced. It doesn’t matter how fast or slowly it happens, or how much time elapses in the interval. The exact waveform doesn’t matter, only the turning points.
In case parts of your mind are still unblown, I’d like to finish with an example where we lay down several memory traces before swiping past them again in one go.
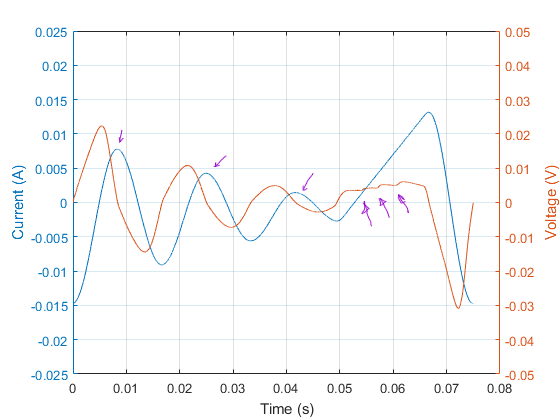
Figure 9: Waveforms for test with multiple reversals.
Magnetic core memories of old stored one bit per core. You’ve just seen a single core store and recall several bits, easily.
Hysteresis distortion isn’t something that we simply decided to big up in search of a USP. It’s very real, very different from what you’d expect and not at all subtle. It takes the form of popping or crackling noises that go off at almost but not entirely random moments. You can’t rely on masking to render it inaudible because cause and effect are not coupled in time and the distortion level tracks the signal level. It is not like normal distortion that the ear just files away as coloration, or can otherwise get used to. Left to its own, hysteresis produces a recognizable grainy texture in the sound, a blanket of fuzz that always stays just this side of audible, taunting and infuriating like an itch you can’t scratch.
This is why we put so much effort into removing it from our amplifiers and speaker drivers.